Overview
1. LIFE EXPECTANCY MALAYSIA
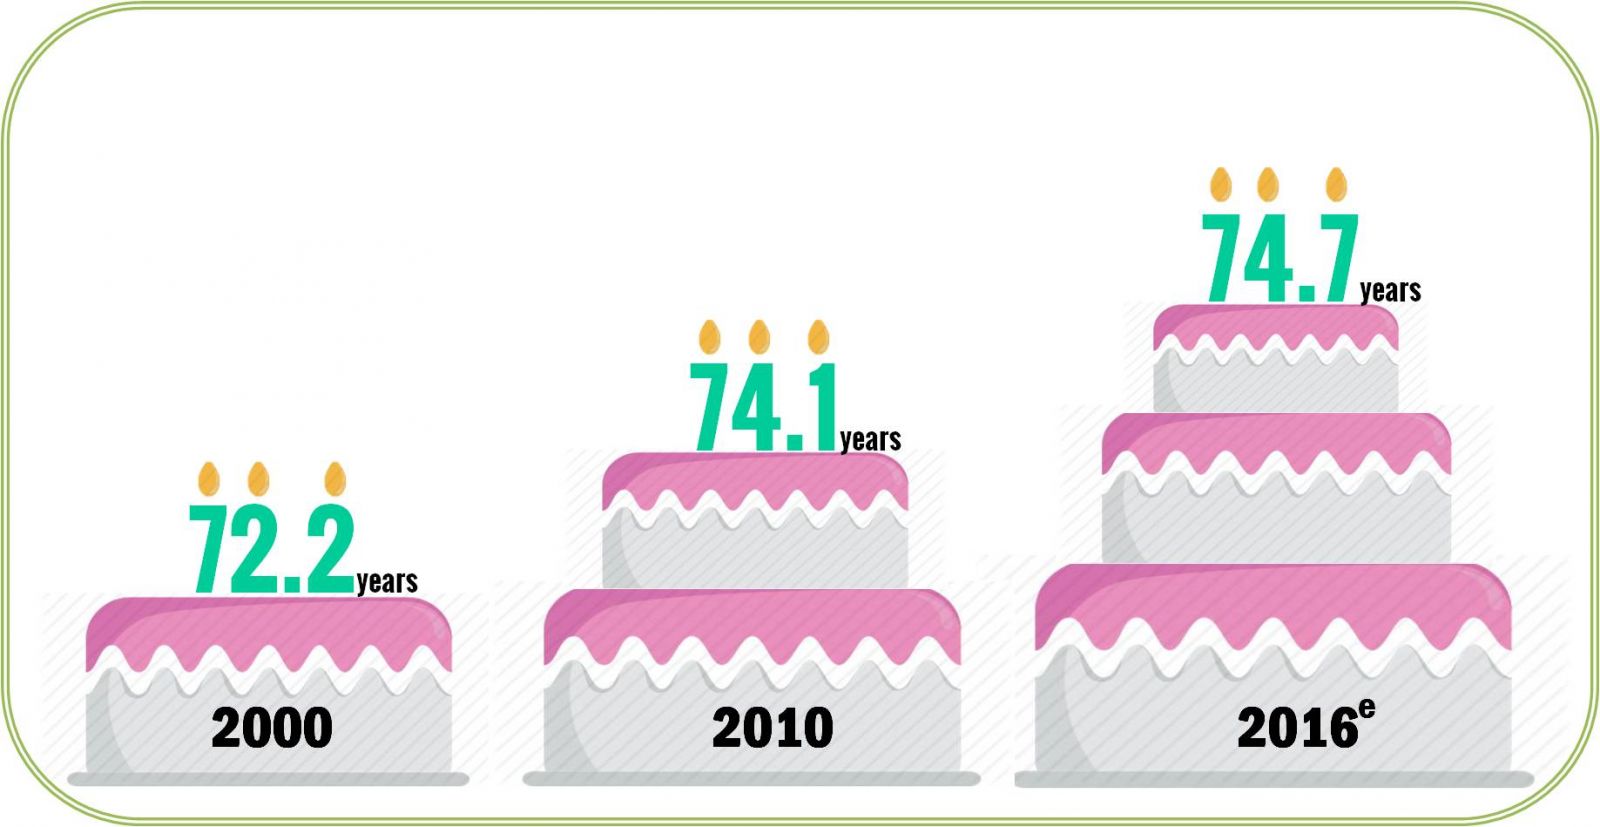
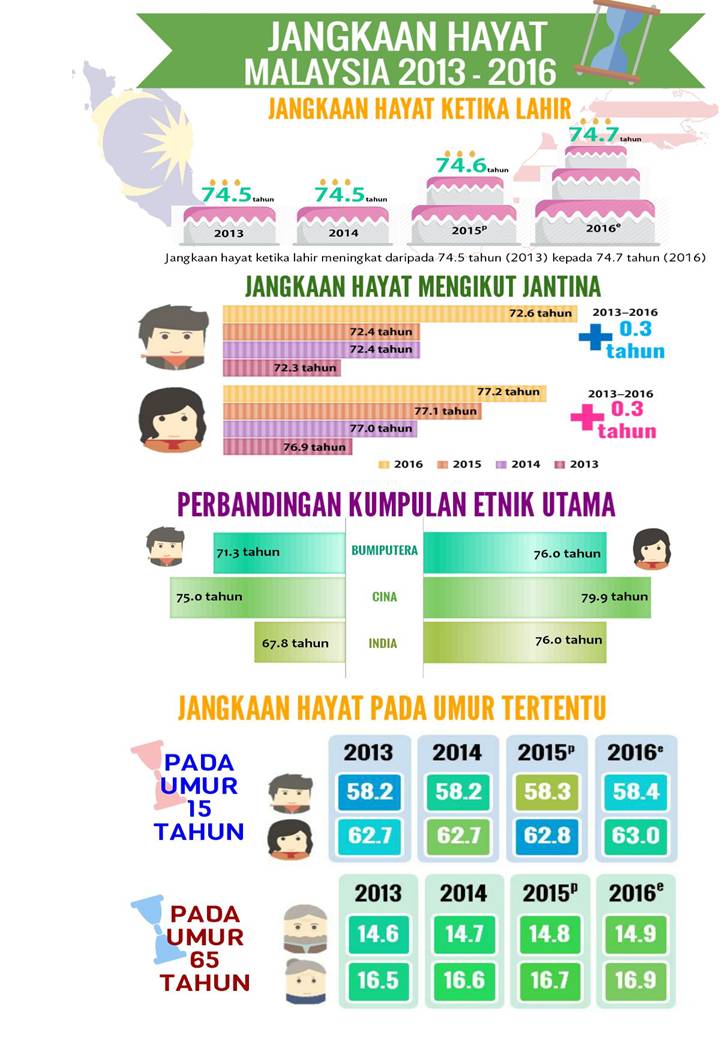
Life expectancy at birth of Malaysia population continues to rise over the past decades to reach 74.7 years in 2016 compared to 72.2 years in 2000.
Figure 1: Life expectancy, Malaysia, 2000, 2010 & 2016e
2. LIFE EXPECTANCY AT BIRTH
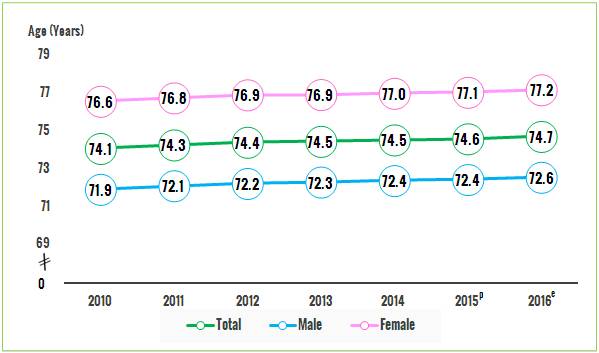
In 2016, a newborn baby boy could expect to live 72.6 years and a newborn baby girl to live 77.2 years. Male life expectancy increased by 0.7 years, from 71.9 years in 2010, meanwhile female life expectancy increased by 0.6 years, from 76.6 years for the same period.
The gap between male and female life expectancy at birth has been vary around the range of 4.6 years to 4.7 years throughout the period of 2010 until 2016.
Chart 1: Life expectancy at birth, Malaysia, 2010 – 2016
3. LIFE EXPECTANCY AT AGE 15 YEARS
Female at Age 15 Years Old Live 5 Years Longer
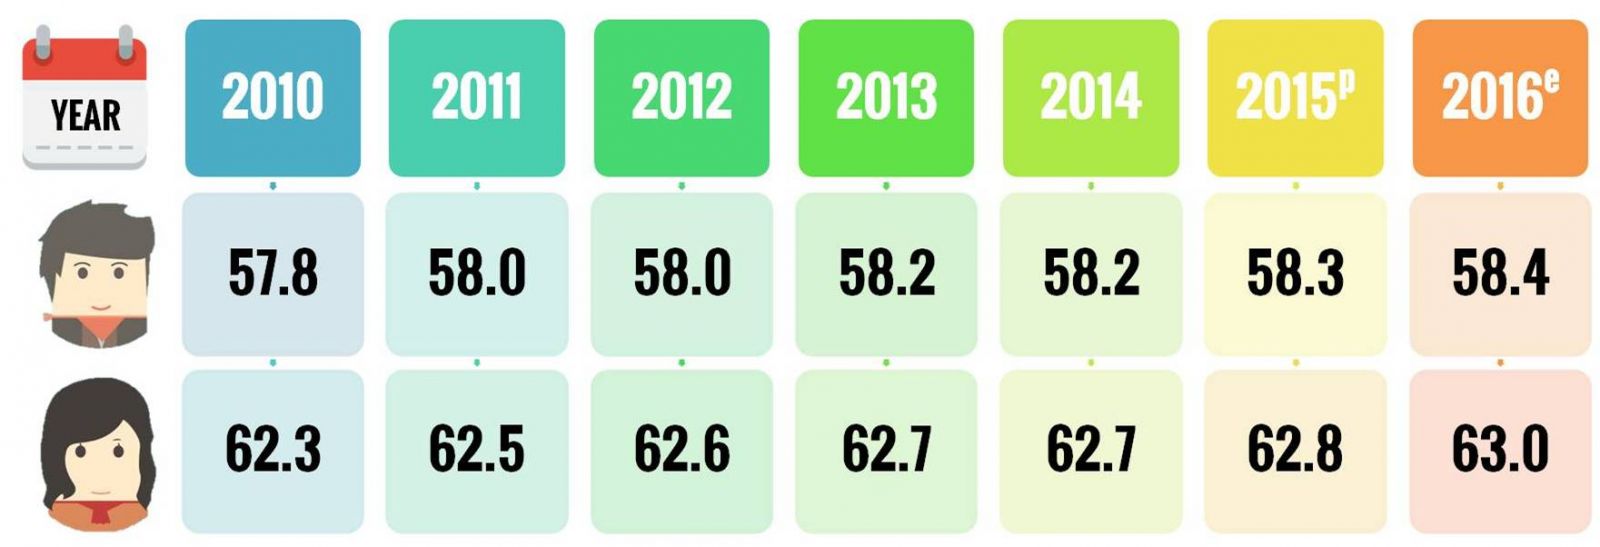
Life expectancy at age 15 years for male was 58.4 years in 2016 and for female it was 63.0 years. This means that a male aged 15 years could now expect to live to age 73.4 and a female to age 78.0. The gap between male and female life expectancy at age 15 years was 4.6 years.
The difference between male and female life expectancy at age 15 years has remain fairly steadily over the years with around 4.5 years and 4.6 years. The gain in life expectancy at age 15 over the period of 2010–2016 was 0.6 years for male and 0.7 years for female.
Figure 2: Life expectancy at age 15 years, Malaysia, 2010–2016
4. LIFE EXPECTANCY AT AGE 65 YEARS
Smaller Life Expectancy Gap at Age 65 Years
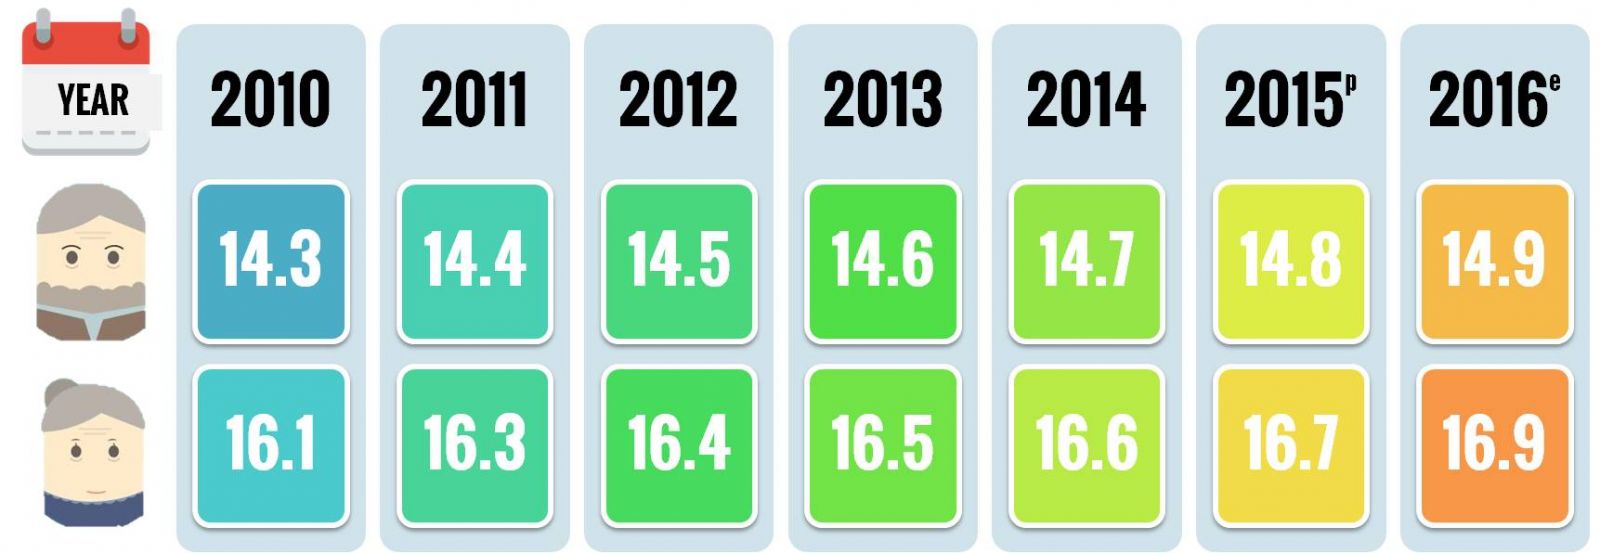
A male aged 65 years had a life expectancy of 14.9 years in 2016. For female the equivalent figure was 16.9 years. This means a male aged 65 could expect to live to age 79.9 years old and a female expected to live to age 81.9 years old. Over the period of 2010–2016, the gap between male and female life expectancy at age 65 is lingered around 1.8 to 2.0 years, with female expected to live longer than male on average at this age.
Figure 3: Life expectancy at age 65 years, Malaysia, 2010 – 2016
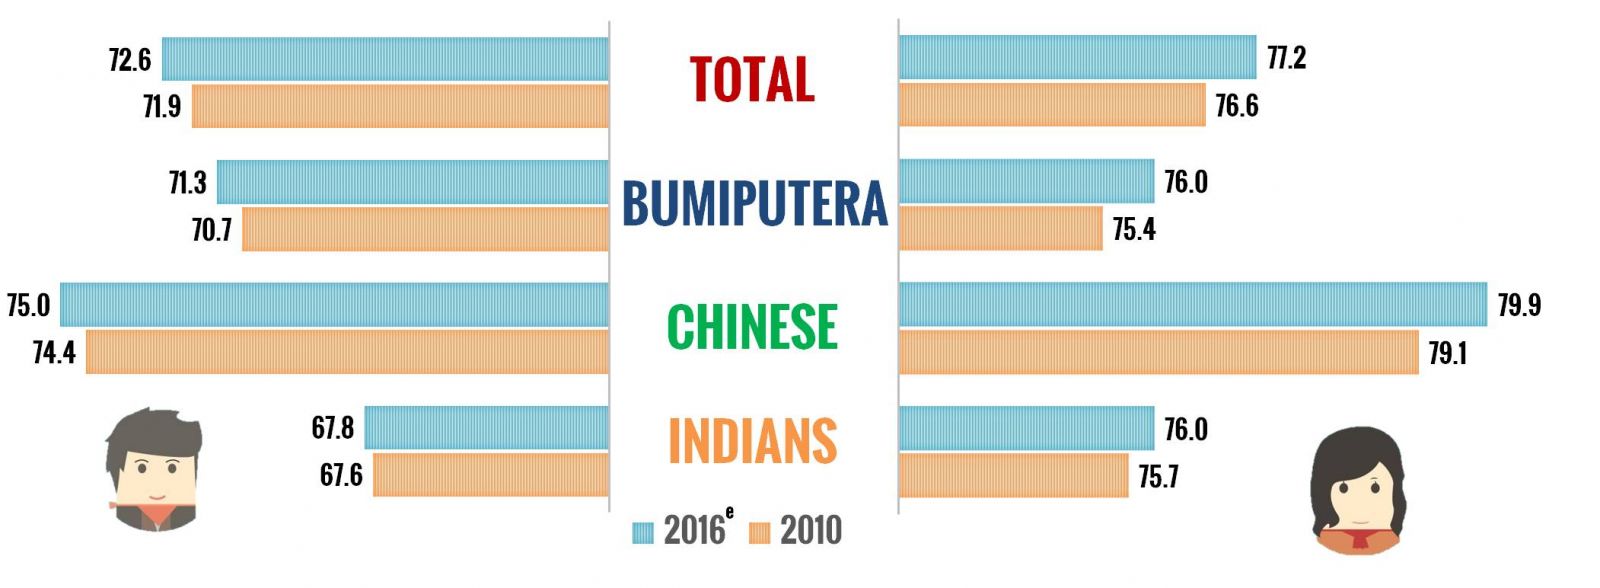
5. LIFE EXPECTANCY BY MAJOR ETHNIC GROUP
Chinese Expected To Live To 77.3 Years
All ethnic groups recorded an increase for life expectancy at birth for the period of 2010–2016. Ethnic with the highest life expectancy among major ethnic groups in Malaysia is Chinese with 77.3 years, followed by Bumiputera (73.6 years) and Indians (71.8 years). The highest life expectancy was Chinese with 75.0 years (male) and 79.9 years (female). The lowest life expectancy by sex was Indians with 67.8 years (male) and 76.0 years (female).
Chinese recorded the highest increment of life expectancy by with 0.6 years (male) and 0.8 years (female) for the period of 2010–2016. In contrast, Indians recorded the lowest rise in life expectancy with 0.2 years (male) and 0.3 years (female) for the same period.
Figure 4: Life expectancy at birth by major ethnic group and sex, Malaysia, 2010 and 2016e
*Notes:
- Data for 2015(p) is preliminary.
- Data for 2016 (e) is estimate.
|
Released By:
THE OFFICE OF CHIEF STATISTICIAN MALAYSIA
DEPARTMENT OF STATISTICS, MALAYSIA
31 October 2016
Contact person:
Ho Mei Kei
Public Relation Officer
Corporate and User Services Division
Department of Statistics, Malaysia
Tel : +603-8885 7942
Fax : +603-8888 9248
Email : mkho[at]stats.gov.my