Overview
This publication presents abridged life tables at Malaysia level for the years 2012 - 2015. The life tables provide estimates of life expectancy by age, ethnic group and sex based on age-specific mortality rates. Life expectancy is the average remaining age (years) for a person is expected to live at the beginning of the certain age. Life expectancy at birth is an estimate of the average number of years a newborn baby is expected to live, if he or she were to experience the age-specific mortality rates of the reference period throughout his or her life.
KEY FINDINGS
Publication of Abridged Life Tables, Malaysia, 2012 - 2015 presented in this report are Life expectancy at birth, Life expectancy at 15 years, Life expectancy at 65 years and Life expectancy by major ethnic group.
LIFE EXPECTANCY AT BIRTH
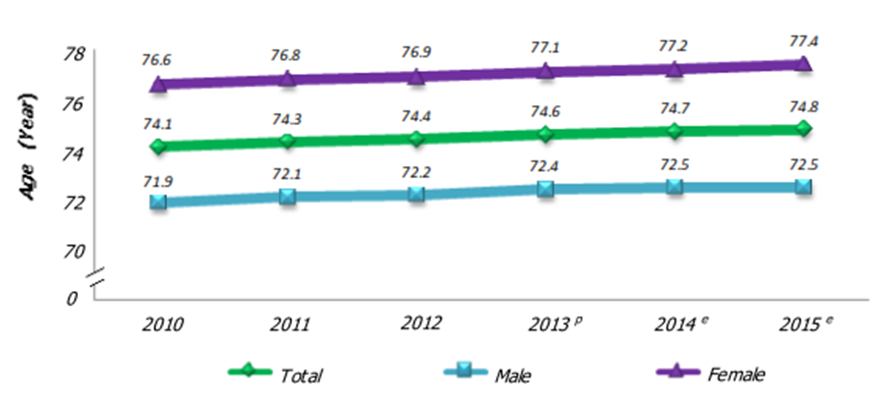
Life expectancy at birth of Malaysian residents continued to rise every year. In 2015, a newborn is expected to live to 74.8 years, increased by 0.7 years as compared to 74.1 years in 2010.
On average, a new-born female is expected to live longer than a new-born male. A new-born female in 2015 is expected to live to 77.4 years and for new-born male to 72.5 years, increased by 0.8 years and 0.6 years respectively as compared to 2010.
The difference in life expectancy at birth between sexes in 2015 was 4.9 years.
Chart 1: Life expectancy at birth, Malaysia, 2010-2015
p Preliminary
e Estimates
LIFE EXPECTANCY AT 15 YEARS
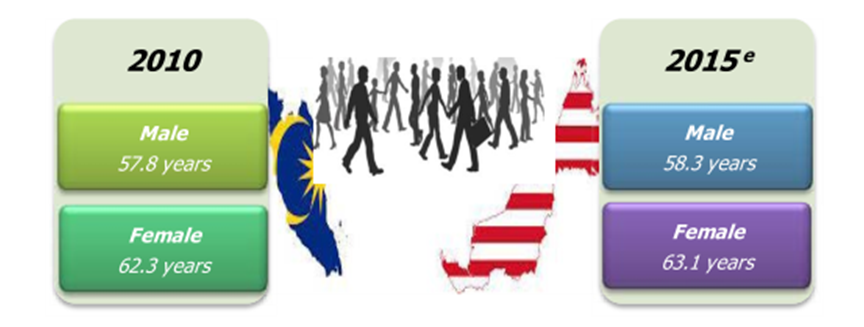
Life expectancy at age 15 years continued to improve over years. Between 2010 and 2015, life expectancy increased by 0.5 years for males and 0.8 years for females.
In overall, the difference in life expectancy at 15 years between males and females was 4.8 years in 2015.
Figure 1: Life expectancy at 15 years, Malaysia, 2010 and 2015e
e Estimates
LIFE EXPECTANCY AT 65 YEARS
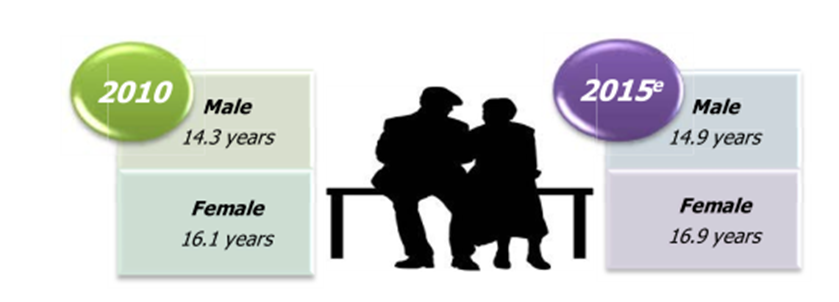
For males who reach the age of 65 years in 2015, is expected to live for another 14.9 years, increased by 0.6 years as compared to 2010. Similarly, females were expected to live for another 16.9 years increased by 0.8 years as compared to 16.1 years in 2010.
The difference in life expectancy between sexes in 2015 was 2.0 years as compared to 2010 by 1.8 years.
Figure 2: Life Expectancy at 65 years, Malaysia, 2010 and 2015e
e Estimates
LIFE EXPECTANCY BY MAJOR ETHNIC GROUP
Throughout the period of 2010 - 2015, Chinese continued to have the highest life expectancy among major ethnic groups in Malaysia for male (75.1 years) and female (80.1 years). Meanwhile, Indians recorded the lowest life expectancy at birth with 67.7 years (male) and 75.8 years (female).
All ethnic groups recorded an increase for life expectancy at birth for the period of 2010 to 2015. The highest increase of life expectancy for males recorded by Chinese with 0.7 years, followed by Bumiputera (0.5 years) and Indians (0.1 years). Chinese also had the highest increase of life expectancy for female by 1.0 years followed by Bumiputera (0.7 years) and Indians (0.1 years).
.jpeg)
The detailed information regarding this report can be accessed through the eStatistik application in Department of Statistics Malaysia website, www.dosm.gov.my.
Released By:
THE OFFICE OF CHIEF STATISTICIAN MALAYSIA
DEPARTMENT OF STATISTICS, MALAYSIA
30 October 2015
Contact person:
Norrita binti Amran
Public Relation Officer
Corporate and User Services Division
Department of Statistics, Malaysia
Tel : +603-8885 7942
Fax : +603-8888 9248
Email : norrita.amran@stats.gov.my